IMPORTANT INFORMATION
Please note that as of 24th June 2002 the Pseudospectra GUI has been
superseded by EigTool; all existing functionality
has been preserved in the new package, which now incorporates MATLAB's
eigs command directly, allowing the user to visualise the convergence
of eigenvalues during the iteration. Many new pseudospectra features have also
been added, including over 30 Demos of pseudospectra applications and the
ability to view transient behaviour in ||A^k|| and ||e^{tA}||.
MATLAB Pseudospectra GUI
Tom Wright
Oxford University Computing Laboratory
Click here (or on the picture below) to scroll
down.
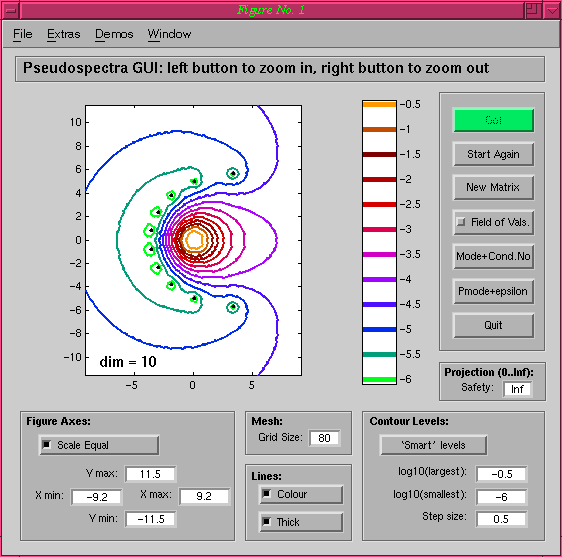
The MATLAB Pseudospectra GUI (Graphical User
Interface) has been designed to make computing pseudospectra fast and
interactive. Some of the features include:
- Speed: once the GUI has been initialised,
all computation is O(N2)
- Interactive zooming with the mouse
- `Smart' default contour levels, and the ability to change the levels
plotted without re-computation
- Easy control over axes and grid size
- Choice of colour or black and white
- Ability to bypass the GUI and use the underlying routines as an
engine for pseudospectra computation
- Option of projecting onto a lower-dimensional subspace for extra
speed
- Connection to eigs for pseudospectra of large matrices (see
Using the GUI with sparse matrices)
- Direct pseudospectra computation for sparse matrices
- Computation of eigenvalue condition numbers
- Display of estimated remaining time for longer pseudospectra computations
Version 1.3 has the following
additional features (see also Version History for the Pseudospectra GUI).
- Ability to compute pseudospectra of rectangular matrices
- Ability to plot eigenmodes and pseudoeigenmodes
- Ability to comptute the field of values (numerical range)
- Option to plot the grid used for the pseudospectra computation
- Option to display the matrix dimension on the pseudospectra plot
- Other minor bug fixes and enhancements
There are two main areas of use for the GUI:
- To compute the full pseudospectra of
dense matrices
of dimension up to the order of a thousand (available
for MATLAB version 5 and greater)
- To compute an approximation to a portion of the pseudospectra of
large sparse matrices around the eigenvalues determined using
eigs (available for MATLAB version 6 only)
This site is organised into several sections:
The following papers describe some of the algorithms used within the GUI:
If you wish to cite the Pseudospectra GUI, please use the URL
http://www.comlab.ox.ac.uk/pseudospectra/psagui/.
The author of the package is Thomas G. Wright, Oxford University.
Disclaimer
This software package is delivered "as is". The author does not make
representation or warranties, express or implied, with respect to the
software package. In no event shall the author be liable for loss of
profits, loss of savings, or direct, indirect, special, consequential,
or incidental damages.
Return to the  , or
Tom Wright's homepage. , or
Tom Wright's homepage.
|

