Examples from engineering
See also Examples of pseudospectra, and the

Below are three examples taken from engineering problems available at
Matrix Market. The
examples are:
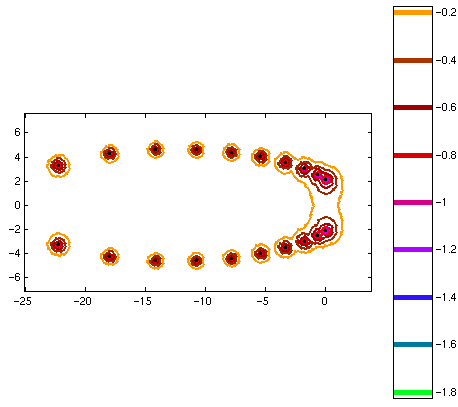
 This matrix is the Jacobian from a model of the
concentration waves for reaction and transport interaction of chemical
solutions in a tubular reactor. Stable periodic solutions exist for a
parameter when the rightmost eigenvalues of the Jacobian are purely
imaginary. For a matrix of dimension 5000, using a subspace of
dimension 100 and asking eigs for 20 eigenvalues, we obtain
the eigenvalue estimates and approximate pseudospectra shown above.
Although the matrix is evidently slightly more non-normal at the right
hand side, the non-normality is mild, and the conclusion from this
computation is that the Ritz values returned by eigs are
accurate and that the computation has been successful.
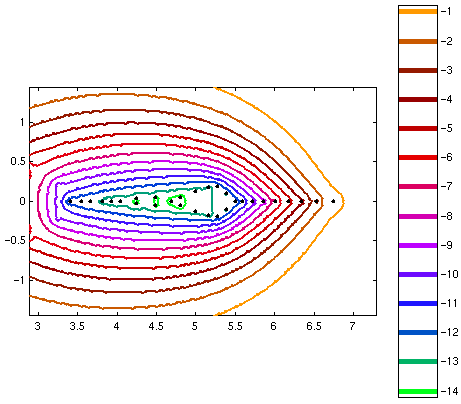
 The matrix here arises in a stability analysis of a
crystal growth problem. The eigenvalues of interest are the ones with
largest real part. The fact that we can see the 10-13
pseudospectrum (when the axis scale is O(1)) indicates that
this matrix is significantly non-normal, and although the matrix is
too large for us to be able to compute its exact pseudospectra for
comparison, this is certainly a case where the non-normality could be
important, making all but the rightmost few eigenvalues
non-physical. The eigs parameters we used in this case were
p=80 (subspace size) and k=30 (number of requested eigenvalues), and
the computation took about one hour on our Sun Ultra 5 workstation.
As far as correlation to the true pseudospectra of this matrix, we
would expect that the rightmost portion should be fairly accurate,
where there is a good deal of Ritz data and relatively little
non-normality, losing accuracy at the left where the effect of the
remaining eigenvalues of the matrix unknown to the approximation
begins to become important, as well as the increased non-normality
making convergence more difficult.
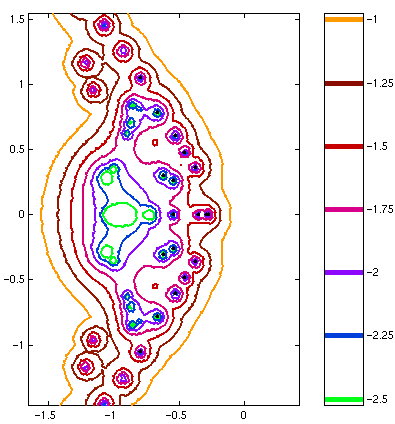
 The third example (above) shows the pseudospectra of the matrix
created by performing transient stability analysis of a Navier-Stokes
solver. In this case the matrix appears fairly close to normal, and
the picture gives every reason to believe that the eigenvalues have
physical meaning. Using p=80 and k=30, eigs took about 9 hours
to converge to 18 eigenvalues of the matrix, whilst we were able to
plot the pseudospectra in about 3 minutes (even on the fine grid used
here).
Pseudospectra GUI home page.
|


