Interpretation of the pseudospectra
The initial pseudospectra will be computed when the
GUI starts up. This plot may itself be enough to indicate whether this
matrix is far enough from normal for non-normality to be a potential
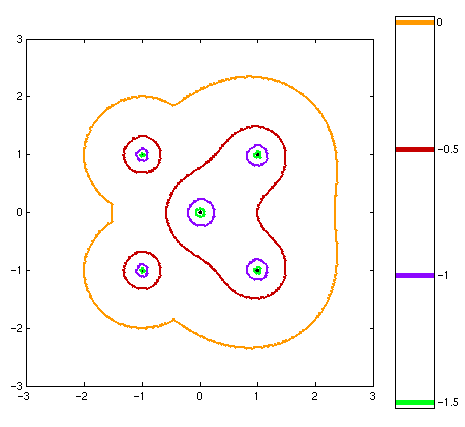
concern. The first image below shows a matrix which is only mildly
non-normal. The epsilon-pseudospectral boundaries are at a distance of
about epsilon from the spectrum. The non-normality is probably not
important. 
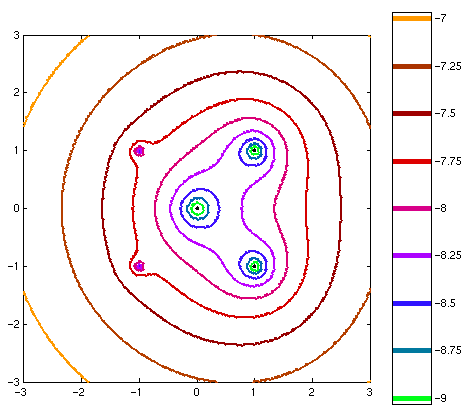
The second image shows a matrix which is more significantly
non-normal. Here, the epsilon-psuedospectra lie at a distance much
greater than epsilon from the spectrum, and the non-normality would
probably be important in a physical application.

For highly non-normal problems, the eigenvalue estimates returned
by the Arnoldi iteration may in fact be incorrect (see the second example), even if they
converge. Perhaps the more serious case is when the Ritz values
returned are accurate approximations to the eigenvalues, but
the eigenvalues are not physically significant due to the
non-normality (see the third
example).
When pronounced non-normality is seen in the initial
plot created by the GUI, one thing to do is to use a finer grid
for the pseudospectra computation. This will take longer, but may
indicate the degree of non-normality more effectively. If the
non-normality is significant, further computations should be performed
before taking the eigenvalues returned at face value.
For more discussion see the 
Pseudospectra GUI home page.
|


